Access the Google Analytics (GA) reports for your department. GA is a complex system, so our goal is to focus on the meaningful site stats.
Accessing Your Report
In Chrome or Firefox go to your report URL (e.g., http://spu.edu/stats-catalog) and login.
Username: YourSpuStats
Password: **************** (case sensitive)Note: If you are already logged in to Gmail (or other Google services), you will need to log out before viewing the report via the provided URL.
Setting the Date Range
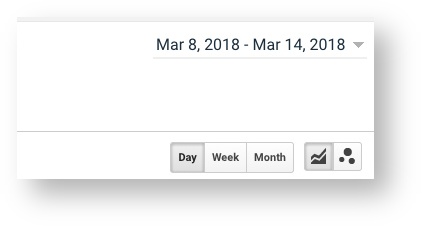
Once you're logged in, you'll see in the upper right corner that the main GA report default date range is for the past 7 days, which can be changed to a specific range (month, quarter, year) by clicking the date range drop-down menu.
Your Main GA Report Stats
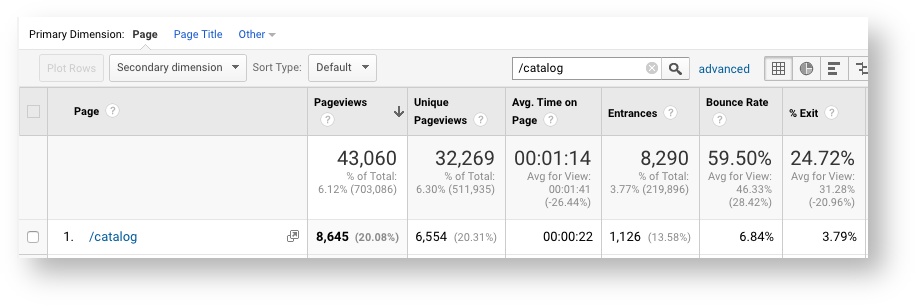
Your report will list the following data/general stats (as defined below):
- Pageviews
- Unique Pageviews
- Average Time on Page
- Entrances
- Bounce Rates
- % of Exits
User Traffic Sources
For information on how users got to your home page, access the “Source / Medium” report:
- From your main report page, click the home page report link (generally #1 on the list of pages).
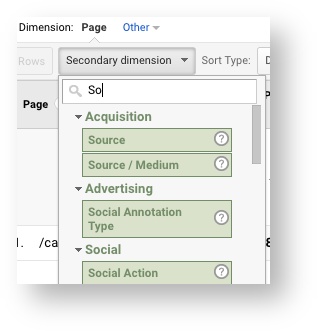
- On the light-grey bar below the blue graph and above the page listings, click the “Secondary dimension” drop-down menu.
- In the search box, type “So”; then click “Source / Medium” in the results.
Navigation Summary Report
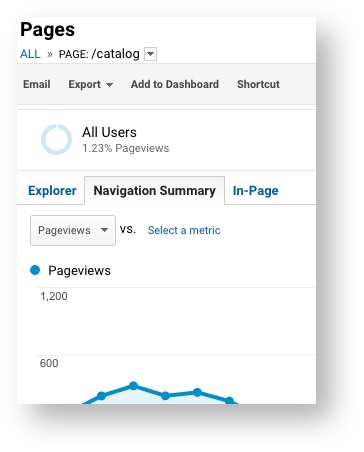
The “Navigation Summary Report” (examining user behavior within the spu.edu domain) shows how users found your landing page, and where they went next.
To access the Navigation Summary Report from your main GA report:
- From your main report page, click the home page report link (generally #1 on the list of pages).
- Click the “Navigation Summary” tab near the upper left corner of the screen to see the “Previous Page Path” (where users came from) and the “Next Page Path” (where users went next) reports listed side by side.
Exporting Your Report to Excel
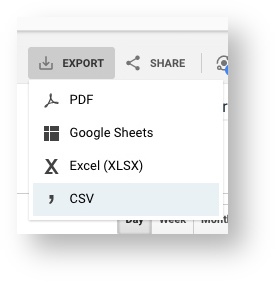
If you want to view your report offline or send it to others, use the “Export” drop-down near the upper right corner and select “CSV” (“Comma-Separated Values”), as it displays best in Excel.
Downloaded all your reports and want them to look nice, use our SPU Analytics Template for Excel.
Glossary
Along with the definitions is some information about what the normal values for some of the different indicators, to give an idea of how well a page or site is preforming.
- Pageviews – The total number of pages viewed. Repeated views of a single page by a single user are counted.
- Unique Pageviews – The number of visits during which the specified page was viewed at least once per unique user. This value is usually about 67% of the total page views.
- Average Time on Page – The average amount of time visitors spend on a page. It’s best if this value is one minute or more, depending on the page content.
- Entrances – The number of times visitors entered the SPU site through that specific page.
- Bounce Rates – The percentage of single-page visits (i.e., visits in which the visitor views only one page and then leaves the site). Below 50% is desirable.
- % Exit – The [number of page exits] / [number of pageviews] for the page. It indicates how often users exit the SPU site from that specific page. Below 35% is desirable, depending on the content of the page.
For more in-depth Google Analytics assistance, contact your communications specialist in University Communications.
